Showing posts with label The crazy world of academia. Show all posts

Thursday, 2 July 2015

Simulating induced seismicity using geomechanics


The best possible words in the life of an academic are undoubtably "paper accepted". Since I've recently had a paper accepted in EPSL. I thought I would add a layman's summary of it here. 

The paper is available here, and is "open access", so you shouldn't need a subscription to read it. 

Our motivation is to try to understand and model why subsurface processes cause induced earthquakes. Induced seismicity has become a controversial issue in relation to fracking, but in fact the risk of inducing an earthquake during fracking are much lower than the risk of inducing an earthquake by other subsurface activities, such as geothermal energy, waste water injection and carbon capture and storage. 

The main reason for this is simply a matter of volume - the more volume you inject, the more likely you are to trigger an earthquake. While much has been made of the water volumes used for fracking, they are actually quite small in the grand scheme of things. The volumes injected for waste-water disposal and for CCS are much larger than the volumes used for fracking. This is why we've seen such increases in seismicity in places like Oklahoma in recent years (it's got very little to do with fracking). 

We've also seen induced seismicity - albeit of small magnitude, less than mag 3 - at two pilot CCS projects, the Decatur project in Illinois, and at the In Salah project in Algeria, which is the subject of our study. 


Firstly, a brief introduction to the In Salah site. It's a gas field in the middle of the Sahara desert. 

Due to natural geological processes, the natural gas that is produced contains a relatively high percentage of CO2. This must be stripped off before the gas can be sold - there are minimum CO2 content requirements. Usually, the CO2 would just be vented to the atmosphere. However, the operators of the site, BP, Statoil and Sonatrach, decided to use the site as a pilot project for CO2. So they instead re-injected the CO2 into the water-leg of the reservoir (part of the reservoir unit that is filled with water rather than gas). The image below shows the basic principles in cartoon form.  

In total nearly 4 million tonnes of CO2 were injected between 2004 - 2011. The average car emits about 4 tonnes of CO2 per year, so that's the equivalent of the annual emissions of 1 million cars.

The site was monitored using a number of methods, but it was clear from relatively early on than the CO2 injection was producing geomechanical deformation. As a result, microseismic monitoring was used to image any small earthquakes. You can read more about the results of the microseismic monitoring here, but the main conclusions were that thousands of small-magnitude (mostly around magnitude 0.0) events had been induced. The largest event was magnitude 1.7, which is probably too small to be felt by humans at the surface (we can detect them with seismometers though of course), and definitely too small to cause damage. Fortunately, all the events were confined to the reservoir unit, so there was no evidence that the seismicity was providing a pathway for CO2 to escape.  


So, what's this latest paper all about?

The basic premise of our study was that induced events occur on pre-existing fractures. They occur because industrial activities change the state of stress in the subsurface, moving a fault from a stable to an unstable state, which allows it to move, triggering an earthquake. So in theory, if we can predict or model where the faults and fractures are, and we can predict or model the changes in stress generated by our activities, we can resolve the stress changes onto the faults, and work out when and where faults might trigger seismicity. The purpose of our paper was to assess how well this approach works in practice. 

To model the size, orientation and positions of faults and fractures I am indebted to my colleague Dr. Clare Bond at Aberdeen, who build a structural model of the reservoir, which simulates how the reservoir geometry we observe today could have formed from the originally-flat sedimentary layers. This produces a strain map, which is then converted into a discrete fracture network to account for how fractures would have accommodated the modelled strain. The resulting fracture map is shown below: you can see that fractures are not uniformly distributed across the reservoir, but there are bands of intense fracturing running through the reservoir, and zones with much fewer fractures. 
In order to simulate the stress changes induced by injection, I am indebted to another colleague, Rob Bissell, from Carbon Fluids Ltd., who built a geomechanical simulation of the injection process. More details about this model are available here. The model provides a map of stress and pore-pressure changes at monthly intervals through the injection period. 

In order to work out whether the modelled stress changes would be sufficient to induce seismicity, for each modelled fracture we resolved the modelled stress from the nearest node of the geomechanical model into normal and shear stresses on the fracture face. If the shear stress exceeded the Mohr-Couloumb criteria, then an event will occur. The size of the event will be determined by the stress drop generated by the event, which will be a function of the shear stress, and the size of the fracture, which is pre-determined in the model provided by Dr Bond. 

Therefore we have a method to simulate when and where an earthquake may occur, and how big it will be. We tested our model simulation results against the microseismic observations made by my colleague Dr. Anna Stork in this paper

The figure below shows that the relative rates of seismicity predicted by the model matches that observed at In Salah. CO2 injection re-starts in late 2009. However, only a small amount of seismicity is observed. Injection rates increase in summer 2010, and for 4 months the rate of induced seismicity also increases. Once injection rates are reduced, the number of events decays away as well. This behaviour is well captured by our model. 
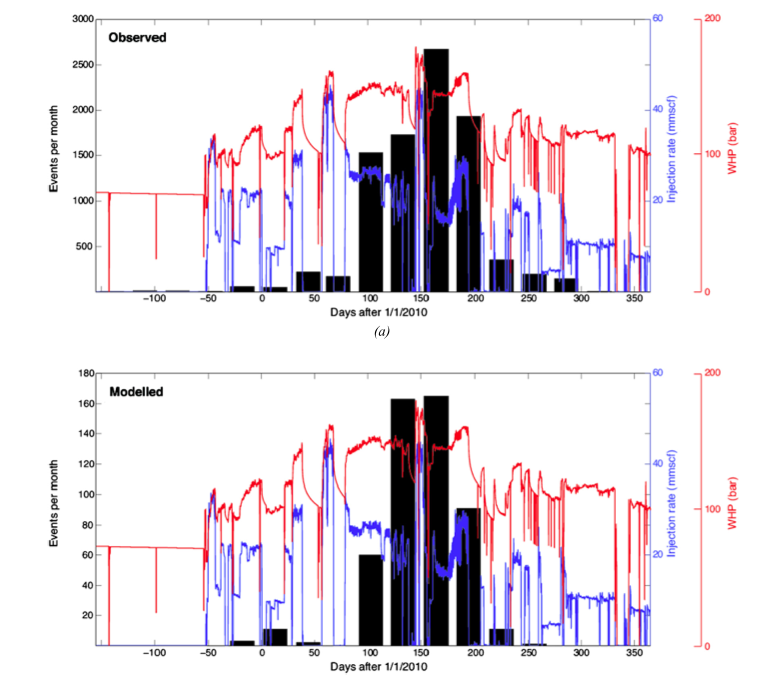

In terms of magnitudes, our modelled largest event matched very well the observed largest magnitude of M=1.7. Magnitudes are determined by the size of the fault and the stress drop, so this indicates that Dr Bond's model did a good job of simulating the fault/fracture sizes, and that Rob Bissell's model did a good job of simulating the stress changes induced by injection. 

Overall, our model does a good job of simulating induced events at In Salah, which is encouraging in terms of our future ability to mitigate induced seismicity at future projects. We have outlined a workflow that can be followed at sensitive sites where induced seismicity may be an issue. For example, the modelling approach can be used to assess whether alternative injection strategies may lower the risk of inducing an event. 


Monday, 11 May 2015

The truth and it's boots: publication bias and shale gas


"A lie can get halfway around the world while the truth is still getting it's boots on". While the origins of this quote are disputed, there can be little doubting of the sentiment behind it.

This can even be true in the peer-reviewed scientific literature: often a "high-impact" finding gets substantial publicity, and is then cited extensively in the literature, while subsequent studies that rebut these findings are, relatively-speaking, ignored.

To be clear, there is no "lying" involved here, in the sense of deliberate misconduct or anything like that. However studies with small sample sizes or especially studies that are poorly designed, are more likely to throw up anomalous results. Once larger studies are performed that are more statistically robust, the anomalous effect, which could have just been a fluke (after all, 95% confidence levels means a 1 in 20 chance of being incorrect), goes away.

This is an important part of science. Smaller preliminary studies may give way to larger studies that produce a more robust result. However, what is important is that the more robust studies are cited as often, or more so, than the one that produced the "sexy" result.

I bring this issue up after reading an interesting blog post here, which considers this issue with respect to educational psychology. An early paper suggested that by making questions on an exam paper harder to read, students would read them more carefully and therefore achieve higher marks.
The study sampled only 40 students. Subsequently, other researchers repeated the study with thousands of candidates, but were not able to repeat the results, finding no difference between test scores regardless of how the question was written.

All well and good, and this is how science should proceed. However the original study, with the result subsequently shown to be incorrect, has been cited hundreds of times and received extensive publicity: it's got halfway around the world - while the subsequent paper, which was much more robust but with a much more prosaic finding - has been cited much less: it's barely got its boots on!


This is analogous to certain papers on shale gas. Papers that claim to find links between shale gas and pollution are far more interesting and scientifically "sexy". Therefore they get widely publicised and cited. Papers that find no links between shale gas and pollution are far more boring, and they fail to get attention. This can be seen in a comparison between several recent papers.

In 2011 a team from Duke University published a paper in PNAS linking shale gas production in the Marcellus to elevated methane levels in groundwater, based on 60 water samples. This paper has been cited over 530 times (Google Scholar). The same team covered the Fayetteville shale in Arkansas in a similar study, but did not find any link between shale gas and groundwater methane. The less-interesting finding was only published in Applied Geochemistry, far less prestigious than PNAS, and has received only 30 subsequent citations.

In 2013 the Duke team published another paper (again in PNAS) again linking methane to drilling in the Marcellus, extending the 2011 study to a total of 140 water samples. Again, the "sexy" result generated substantial interest, and the 2013 paper has been cited almost 150 times. However, also in 2013 a study by Molofsky et al. used almost 2,000 water samples, but did not find any link between groundwater methane and shale gas drilling. Again, this "unsexy" study found it's way into a much lower impact journal ("Groundwater"). With nearly 2,000 water samples vs 140 samples, the Molofsky paper is far more statistically robust than the PNAS papers, yet it has only been cited 50 times.

The impact of this imbalance in publicity has implications for policy-relevant subjects such as shale gas. It is noticeable that recent reports studying the public health impacts of shale gas development, such as the CIEH and Medact reports for example, cite the "sexy" PNAS studies, but fail to cite the more robust Molofsky paper.

To wrap up, publication bias is an acknowledged issue in the academic literature, albeit more so in biological sciences. It is interesting to see it creeping into the geological world. However, I don't really have an easy remedy to conclude with (so suggestions in the comments I suppose).


Monday, 23 February 2015

Should academics be immune from losing their job


** Warning, non-shale gas-related post**

It's been a while since I last posted something not related to shale gas. Instead, in this post I want to discus some recent developments in the academic world.

There is uproar at Bristol University at the sacking of an academic (in the veterinary science department), apparently for failing to secure sufficient research funding. A campaign has been launched for her reinstatement, and it's been reported in local media as well as HuffPo.

This is not an isolated incident. Across the UK, universities are showing themselves willing to fire staff who are failing to bring in research grant money. For instance, staff at Warwick have been threatened with redundancy if they fail to bring in sufficient research income.

I've never been sacked or otherwise forced to leave a job in my life. Therefore I am aware that I am a position of privilege in this regard. I can only imagine the stress and hardship involved. On a personal level, I have every sympathy with Dr Hayman and any other academic threatened with the loss of their position.

However, I think it raises a few issues regarding my chosen profession that I'd like to discuss.

I am currently in a postdoctoral position at Bristol. Most post-docs move from short-term contract to short-term contract (and often from city to city, or even continent to continent to do so), with no job security. Being required to bring in a certain amount of research grant money may indeed put a tenured lecturer "under enormous pressure", as Dr Hayman describes. However, I sincerely doubt that the pressure is greater than that experienced by post-docs as they try to eke out a career in academia.

I speak on behalf of the vast majority of my friends and colleagues as they continuously hunt out new opportunities, with the distant hope of one day reaching that holy grail of a permanent job somewhere (anywhere). Incidentally, post-docs may also be "the sole breadwinner", even more so perhaps because the requirement to move continuously from place to place often makes it very difficult for their partners to build a career of their own.

According to a recent Royal Society report, 30% of people who complete a PhD go on to an "Early Career Research" position. However, of that 30%, only 3.5% go on to get a permanent academic position. This is a huge issue for academia at present.

From the Epigram article, Dr Hayman's last funding award appears to be for £5,000 in 2012. This is barely enough to attend a couple of conferences abroad. Peanuts, in other words. For context, <humblebrag>I have been involved in some way or other (either as PI, Co-I, or writing a grant for my boss to put his name on top of) in over £600,000 worth of grant money awarded during my brief academic career, more than 100 times as much </humblebrag>.

In fact, the biggest surprise to me in the Epigram article is that there are 387 other permanent staff members who also have not brought in any funding in recent years. The job description for a "Pathway 1 Role Profile Level c" position - i.e. lecturer - is listed here, and you can see it includes the requirement to "identify potential funding sources and write, or help to write, bids for research funding".

Anyway, in the last few years I've applied for several permanent academic positions, thus far without success. I have no sour grapes and bear no grudges: in every case the candidate who got the job was better than me. And, incidentally, in almost every case also had a track record of bringing in hundreds of thousands of pounds of funding.

As above, I have every personal sympathy with academics who face losing their jobs. However, as one of thousands of young academics scrabbling from short-term contract to short-term contract, even when bringing in hundreds of thousands of pounds of research money, it's difficult to have any professional sympathy whatsoever when someone loses their job having only brought in £5,000 of funding. Perhaps there are a couple of post-docs waiting in the wings to replace Dr Hayman, with plans for grand and important research programs with the potential to bring in substantial research income. Is it not fair that they should be given that chance, rather than forced out of academia as incumbent staff sit on the choice positions instead?


There are a couple of broader questions to address here:

Should academics be immune from losing their job?
An argument sometimes made is that, once an academic has been appointed to a permanent position, she or he should never by sacked unless they have committed serious misconduct - sexually harassing a student, for example (it does happen, sadly). The basis behind this argument is the importance of academic freedom. It is important that academics are free to pursue their intellectual inquiries wherever they may take them. Sometimes a line of research simply never produces fruitful results.

However, I don't believe that the need for academic freedom means that an academic should never have to justify their position ever again. Pro-active, high quality researchers should be generating research outputs, regardless of whether they do blue skies research or applied research, and regardless of whether individual projects happen to succeed or fail. In any other job, if you are not meeting the expectations of your employer, you will be sacked. I believe that academics have to live with the pressures of the real world, just like everyone else. Otherwise, there is in theory no reason for an academic, once in a permanent position, ever to turn up for work again!

Is research grant income the best metric of success?
The first question is obvious, even though we often don't act like it (it is still very rare for a an academic in a permanent position to be removed). However, I accept that there may be good arguments for other, better metrics to use.

One metric is definitely not considered relevant, and that is teaching ability. Despite what many undergraduates may think, the primary role of academics is to produce top quality research, not to teach undergraduates. Every post-doc knows that it is their research metrics that will land them that permanent job, not their teaching ability. You could be the worst teacher ever (and I've experienced a few contenders first-hand), but if you've got a good research profile, it doesn't matter.

There is a case to be made for a new system where research and teaching career paths are more clearly defined and separate (i.e. you have teaching staff who only teach, and research staff who only do research, and very few staff who mix the two). However, such a system would probably be more expensive, because you'd need twice the staff for the same overall output. Anyway, we don't have that system now, so we are where we are, and it is your research that counts.

Academic metrics in general are a tricky thing. Numerous options exist, from impact factors, H-indices, REF scores, and grant income, to name a few. Estimating the quality of academic output is something of an intangible judgement call. In general, I would expect people with experience in the field to be capable of differentiating high and low-quality research programs. However, coming up with quick and easy metrics to quantify that difference isn't easy.

However, these things tend to correlate. While REF scores aren't solely based on journal publications (academics can have impact in other ways, through government policy and through contributions to industry, for example), an academic with a stack of papers in high impact journals is unlikely to fare badly at REF, and will likely accumulate a decent H-index over time. A track record of high impact research publications is also likely to translate into research funding success as well: if the editors of Science and Nature think someone's research is really interesting, then those on funding panels are, generally speaking, likely to think so too.

Ultimately, when departments hire someone on the basis of one or many of these metrics (or the intangible judgement call that we might replace them by), it is because they hope that a successful researcher is likely to bring in future grant money. So really, as far as administration is concerned, going straight to the funding record cuts out the middle men, especially once employees have been in place for a number of years.

I don't deny that grant success rates are low for some funding councils. NERC grant success rates are typically around the 20% mark, for example. And, yes, funding body decisions can be capricious. However, there are a lot of funding sources out there if you know where to look. This doesn't even have to include industry sources. For example, in the last few years our group has pulled in funding from UK research councils, but also from various EU grant-making bodies, from charities, and even from both the Canadian government and the US government. Yes, it can be a hard slog as you drag your research idea from potential funder to potential funder. But capable researchers are able to find ways to get their work funded.

Why does the money matter? Employing a staff member costs money, and the administrators need to ensure that the department's income equals or exceeds the total cost of running it. If the cost of running a department, a significant chunk of which is staff costs, exceeds the revenue it generates, then over the long term it will likely be faced with closure (and then everyone loses their jobs, regardless of their research metrics).

I will use my own department as an example. Bristol Earth Sciences is a fairly typical, medium-sized science department. We usually have about 200 - 250 undergrads spread over 4 years, and 40 full time academic staff. These students will be paying £9,000 per year. Taking a mid-range value (let's say 222 students, because it rounds easily), this gives us an income of £2,000,000 from student fees. Divided between 40 staff, this is an income from teaching of £50,000 per staff member, which is in the ball-park for a typical academic salary.

So student fees appear to just about cover staff costs. But remember, we also need to pay for buildings, electricity, heating, the internet, a library (with expensive journal subscriptions), teaching labs (and materials and equipment to go in the labs), employer's national insurance contributions, pension contributions, administrative staff, cleaning staff, computing facilities, a contribution to the university's central administration, contributions to capital funds to build new buildings or renovate existing ones. The list goes on and on.

Now, most departments will also receive the HEFCE block grant, which will offset some of these costs. But the overall equation stays the same: for a medium-sized science department, unless millions of pounds of research funding are brought in every year, then things soon become financially unsustainable.

Assume a department needs £2 million per year of research income. Divided between our 40 staff members, that's an average of £50,000 per staff member, which interestingly is in the similar to the requirements reportedly placed on Warwick's academics, which demonstrates that I'm in the right ball-park with my numbers here.

Finally, if staff aren't bringing in research grants, then a department will be able to fund only a small number of Ph.D. places, and no post-doc staff whatsoever. I suppose that'd solve the issue of post-docs to permanent jobs issue, but realistically I don't think it's a direction we want to be going! A department unable to offer post-doc opportunities isn't really conceivable. Yet most post-doc positions (such as mine) are funded by external research income from funding bodies.

So I don't think department administrators are obsessed with money because they're a bastard children of Scrooge McDuck and the Wolf of Wall Street. I think they're trying to ensure that their departments are financially viable, so that they stay open.


Now, the simple solution here is to provide more funding to universities. Ideally we'd have unlimited funding, and that way we could give permanent jobs to all the post-docs while keeping all our current permanent staff in jobs as well, regardless of research output. However, we must play the hand we've been dealt.

I have been involved in campaigns to persuade the government to increase (or at least keep constant and not cut) academic funding, and I urge you to do so too: increased funding for science is incredibly important in what is increasingly becoming a knowledge-based economy. However, there are many worthy causes in need of the public money, and not enough of it to go around. So we're unlikely to see huge increases in academic funding anytime soon, even in the most optimistic scenarios.

In the meantime, we need to ensure that the system is fair both to those currently in permanent positions, as well as those seeking those permanent jobs. I'll happily accept that there may be better metrics out there than grant income, however it must be accepted that ultimately grant income is very important for the continued success of a department. A system where, once given a permanent job, an academic cannot be replaced even where there are more productive candidates (by whatever metric you prefer) stuck on short-term contracts to the extent where they are leaving the field by the thousands, is not a fair system.


Wednesday, 4 February 2015

Prof Smythe: "Well" out of date


It would appear that I have a new admirer. Imitation being the sincerest form of flattery, I consider myself very flattered that Professor Smythe has created a blog in my honour, going so far as to name it "Frackland" in reflection of my own small contribution to the national shale gas debate.

Prof Smythe has featured previously on this blog, firstly when I pointed out errors in his critique of Cuadrilla's Balcombe operations, and subsequently to document his contretemps with the Geol. Soc. and Glasgow University.

In his original critique of Cuadrilla's operations at Balcombe, Prof Smythe proved himself to be ignorant of modern drilling technologies. Sadly, it seems that Prof Smythe has doubled down on his errors in a new presentation, which, in a comment on his blog, he claims "show[s] that it is James Verdon, not I, who misunderstands the technology of drilling".

In his latest piece, Prof Smythe admits to learning about geosteering and LWD at the Dart Airth CBM planning inquiry, and grudgingly concedes that one of my principal criticisms was, in fact, accurate: "It is correct that I did not at that time know about the gamma-ray geosteering technique." I would add that listening to a submission at a planning inquiry does not make anyone an expert in anything.
 
It is interesting that Prof Smythe refers to a "gamma ray" geosteering technique. I don't actually refer specifically to gamma-ray logging at any point in my original comments. There is a reason for this: there is a huge range of LWD measurements that can be made to measure the properties of the rocks through which a well is being drilled.

The motivation for this is severalfold - in addition to the real-time aspect of LWD, in horizontal wells a "well tractor" is required to pull wireline logging tools (the traditional method of well logging, done once the well had been drilled) along the horizontal section of the well, which can be time consuming and expensive. LWD obviates this need, so as a result in the last 20 years much effort has been put into developing LWD tools that can match traditional wireline tools both in terms of the different petrophysical measurement techniques, and the quality of the measurements.

If Prof Smythe thinks that LWD is limited to a non-directional gamma-ray measurement then he is still spectacularly uninformed as to the state of modern drilling technology.

Almost every traditional wireline logging tool is now available as a LWD equivalent. This might include measuring the electrical resistivity (which is particularly sensitive to whether the rock is full of oil/gas (high resistivity) or salt water (low resistivity)), the porosity, the bulk density, and the acoustic properties of the formation, in addition to its gamma-ray levels. The latest technologies can even tell you the colour of the rock you are drilling through (organic-rich rocks tend to have a dark colour), and microimaging even takes images of the rock as you go!

Equally importantly, these measurements are not taken uni-directionally. Modern LWD tools take measurements at many angles to the well bore. This enables an operator to identify the dip of the beds through which he is drilling, as demonstrated in the image below, taken from a Schlumberger Oilfield Review paper. Note that this SOR is from 1996, which gives an indication of how out-of-date Prof Smythe's comments are. Prof Smythe (and the interested reader, of course) would do well to peruse the latest offerings from the various oilfield service providers, such as this from Weatherford or this from Schlumberger.

So, how does all this tech help an operator stay in zone while drilling a horizontal well. In most cases, an operator will have prior geological data from logs run in vertical wells (such as Cuadrilla will have had from Conoco's drilling of the first Balcombe well in 1986). They will have identified marker beds from this log data, characterising the petrophysical properties of each different layer (the resistivity, porosity, density, acoustic properties, the microimages etc.). These marker beds, along with the dip information, are then used to guide the horizontal wellbore and stay in formation. If a fault is intersected, the well will find itself in a different geological layer. The operator can determine which layer this is by comparing the LWD data with pre-existing logs and, in combination with the dip data, determine where the well must be steered in order to return to the formation.

Now, if a fault is encountered that has substantial offset, it may not be possible (or economic) to steer the well back to the target formation, and the well must be abandoned. And of course it's better if an operator has 3D seismic data to help plan their wells, and to ensure that their LWD matches the 3D seismic data. I make this point in my original post, and I expect that as operators move from exploratory to production phases, we will see more 3D seismic data collected. However, LWD data alone is usually sufficient to keep a well on target, even if faults are encountered.

Importantly, however, the proof is in the pudding.

One of Prof Smythe's principal conclusions was that keeping the well within the 30m thick target layer would be a "near impossibility", "all-but impossible", and "the drilling will therefore almost certainly transgress into the Kimmeridge Clay, either above and/or below the micrite (the target layer)." Indeed, Prof Smythe goes so far as to claim that Cuadrilla will intentionally drill out of formation in order to collect samples of Kimmeridge Clay with a mind to future fracking at Balcombe, and makes the claim that Cuadrilla's activities at Balcombe were little more than a "cover story" for future unconventional work.

Prof Smythe maintains that "[his] criticism of Cuadrilla in 2013 was and remains substantially correct". However, in September 2013, Cuadrilla announced the results of their Balcombe well, and that "using geo-steering technology, the entire 1700ft was successfully drilled within the target limestone".

Now, Prof Smythe might claim that Cuadrilla are still deceiving us. If they are, it would be a odd thing to do, given that all well log data becomes publicly available after a short confidentiality period, so they'd know that they'd soon be found out.

He also makes the unsubstantiated accusation that Cuadrilla may actually have encountered a fault, and that they had been forced to stop drilling as a result:
"We do not know why the horizontal well stopped at 518 m (1700 ft). For all we know, Cuadrilla may have encountered a fault."   
This seems very unlikely. If Prof Smythe were more familiar with the full history of the Balcombe site, he would have been aware that Cuadrilla's planning consent for the site expired on the 30th September 2013. By this date they were required to have removed all of their drilling and other kit from the site. The two images below show the drilling equipment on site, and the condition to which Cuadrilla had to return the site by the 30th September.


Cuadrilla completed their drilling on the 23rd September. Prof Smythe claims that Cuadrilla stopped drilling because they had encountered a fault. I would suggest that the far more likely explanation is that they only had 7 days left before their planning consent expired, and wanted to give themselves enough time to run whatever tests they wanted to do, before removing all their kit from the site, and probably leaving a bit of spare time as well in case protestor activities caused further delays (as happened earlier in their operations).

In his original criticism, Prof Smythe made strong conclusions ("near-impossibility", "all-but impossible") , and accused an operator of intentional deceit, which should not be done lightly. I would suggest that when an "expert" claims that something is a "near-impossibility" and "all-but impossible", but then that thing happens, then those claims do not "remain substantially correct", as Prof Smythe claims. In fact, I'd think it would be considered rather embarrassing, and would draw the status of said "expert" into question. Perhaps this is why the Geol Soc asked Prof Smythe to cease referring to himself as a Chartered Geologist.


Friday, 24 October 2014

Sigmas and Sharpshooters


Today's paper is a recent report published in the journal "Earth's Future" looking at methane emissions from shale gas operations in the USA. As you'd expect from a paper that is critical about shale gas exploration, it has received extensive media coverage.

However, the paper falls short in a couple of really important ways, which I'll discuss below. Sadly, it provides a few handy lessons about how not to go about doing science. The first issue is falling foul of the Texas Sharpshooter Fallacy, the second is failing to use the proper measures to ensure the result is statistically significant.

Firstly, the Texas Sharpshooter Fallacy. The parable is of a hopeless Texan gunman looking to prove to the world his martial prowess. So he takes aim with his pistol at the side of a barn, and blasts away. Once he has done shooting, he notices that by chance some of his shots happen to have hit close together. He then paints on a target with its bullseye at that point, before inviting the neighbours over to admire the results of his sharpshooting skills.

More technically, this fallacy describes a situation where certain clusters of data are cherry picked from a larger population because they happen to fit your hypothesis, ignoring all the cases that would disprove the hypothesis.

So how does this fallacy apply to the paper in question? The image below shows the methane measurements for 2006-2008 (the "before" case) and 2009-2011 (the "after" case) presented in the paper:


It's clear that methane has gone up substantially all across the USA in this period. There are many sources of methane emissions, both naturally occurring (bogs, swamps etc) and man made (farms, coal mines, conventional gas wells, and shale wells). What is noticeable is that while there are places where there is shale gas activity and high methane concentrations, there are plenty of places with no oil and gas activity that have seen methane levels rise, while in other places there is shale gas activity but methane levels that are not particularly relevant.

For example, Nebraska saw substantial increases in methane, yet in 2010 there were only 2 drilling rigs in the entire state. It's a similar story in, for example, Iowa (0 drilling rigs), Illinois (2 drilling rigs) and Indiana (3 drilling rigs). In contrast, Arkansas, home of the Fayetteville shale with 39 active rigs in 2010, and Northwestern Louisiana, home of the Haynesville shale with 135 active rigs in 2010, have noticeably low methane concentrations.

There are many different shale gas/oil plays across the USA. It is apparent that methane concentrations also vary across the USA. It is therefore inevitable that, just by chance, some areas of high methane will correlate with areas of shale production. Our sharpshooters have drawn their targets around 3 such areas (the black boxes in the above image) and declared themselves to be expert marksmen. Not good science.

We can see the same effect within the individual study areas as well. The following image shows the change in methane levels for Texas from 2006-2008 to 2009-2011:


During this time, there was active drilling and unconventional hydrocarbon production from the West Texas Permian Basin, the Haynesville Shale and the Eagle Ford Shale. Neither the Permian nor the Haynesville show anything out of the ordinary, while there are other areas with no active drilling that have seen substantial methane increases. It's a similar story for the Marcellus in Pennslyvania, shown below: there are places with drilling that have high methane levels, but also places with drilling that have low measurements, and places with high measurements that do not have drilling.


The second issue is one of error bars and confidence intervals. With any scientific measurement, there is an error bar marking the interval over which we can be confident the result is accurate. Typically, confidence limits of 95% are used - if it is said that a measurement is 5 ± 1.5 at a 95% level, then we can be 95% confident that the true value lies somewhere between 3.5 and 6.5.

The authors of this paper complete their analysis for the Bakken and Eagle Ford shales, concluding that methane emissions have increased by 990 ± 650 ktCH4/yr and 530 ± 330 ktCH4/yr in each case.

What is unusual, however, is the limits they have chosen for their error bars. These are set to the 1-σ level, or one standard deviation. This corresponds to a confidence interval of only 68%, meaning there is a 1-in-3 chance that the computed value was arrived at by chance.

Scientists generally use the 2-sigma level as an error bound - corresponding to a 95% confidence level in the result (which still means that the measured observations could have occurred by pure chance 1 time in 20). For really important experiments, scientists will require even higher confidence bounds, like the 5-sigma bound for the Higgs Boson discovery, which means a 1 in 3,500,000 chance of a spurious result.

I've not often seen a confidence level of 1-sigma being used in peer reviewed science, given the implication of a 1-in-3 chance of being a spurious result. Instead, let us double their confidence levels to the 2-sigma limit (95%) more normally expected as a minimum for scientific findings. We then find the results have become 990 ± 1300 ktCH4/yr and 530 ± 660 ktCH4/yr. In both cases the error bars have become larger than the values themselves. We cannot even be sure whether rates of methane emissions have increased or decreased, since the lower error bars at the 95% level fall below zero.

In short, even with the Texas-Sharpshooting described above, the authors have not managed to produce statistically robust evidence to back up their claims. However, it's given me a chance to discuss both the Texas Sharpshooter Fallacy (which is also a common problem in attempts to forecast earthquakes) and the importance of error bars, which I am sure both scientific and non-scientific readers alike will have enjoyed.


Monday, 6 October 2014

The CIEH and me: full discussion


A few months ago, the Chartered Institute of Environmental Health (CIEH) released a report into the impacts of hydraulic fracturing and shale gas extraction in the UK. You can read the original report here. Of particular concern was that the report's lead author had already taken a leading role in protests outside of unconventional gas drilling sites in the UK: hardly the best place to start if you are looking for a balanced report.

In my opinion, the quality of the report was very very poor, ranking as little more than scaremongering and with little understanding of the oil/gas extraction process. I was infuriated enough to write a rather outspoken blog post criticising the report, which some readers might remember.

In the days following the report's publication, I ordered my thoughts a little from my original post, and sent a more moderate and thoughtful criticism to the CIEH. The CIEH provided an initial response to my criticisms.

Incidentally, the CIEH made their response public, without actually stating my criticisms alongside their response (or informing me that they had done so). I can only assume that they weren't comfortable seeing their response alongside my original criticisms.

This wouldn't surprise me given the weakness of the response. In some places their is direct and/or tacit admission of error, while in others the authors manage to contradict themselves. I was originally prepared to let sleeping dogs lie and "agree to disagree", especially since I had a busy fieldwork schedule over the summer. However, the quality of the response was so poor that I couldn't help but write a further comment to the CIEH. I have not now received a response to those comments (nor do I expect to, if I'm honest), so I have decided to make public the full extent of our discussion for all to see.

I should add a warning, these are fairly lengthly documents, but hopefully make for an interesting read if you have a few minutes to spare and a cup of tea to hand.

My first critique of the CIEH report is here.

The CIEH response to my critique is here.

My comments on the CIEH response is here.


Wednesday, 17 September 2014

New Life-Cycle Assessment for UK Shale Gas


A new life cycle assessment for UK shale gas has been released by researchers from the University of Manchester. This study considers a range of potential environmental impacts. Most significantly, it compares shale gas extraction against a host of other energy technologies, including conventional gas, coal, nuclear power and renewables. 

This sort of comparison is very important, because when it comes to energy sources, we have to choose how our energy mix should be balanced. All sources of energy have impacts, and we can't say no to all of them. 

Equally significant is the fact that the study doesn't just consider the global warming impact of the various technologies (the global warming potential, or GWP), but a whole host of environmental factors , including the use of abiotic resources (rare earth elements etc), acidification, eutrophication, freshwater, marine, terrestrial and human toxicity, and ozone depletion. 

Before I get into the details of the study, the first figure I'll borrow is the one that compares the global warming potential (GWP), according to the various previous studies: 


Tuesday, 22 July 2014

Another day, another shale gas report

Update (23.7.2014): It transpires that Gwen Harrison, the report's lead author, was recently an election candidate for the Green Party, which has explicitly stated its opposition to fracking in all circumstance. Moreover, judging by recent tweets it seemed she was involved blockading trucks at IGas's Barton Moss site.

Of course, there's nothing wrong with joining political parties nor joining protests. However, it makes a mockery of the claim that the report is "impartial" and "evidence-based", and goes a long way to explaining the report's contents.


Original Article:
Another day, another shale gas report to dissect. Today's offering comes to you courtesy of Scientists for Global Responsibility and the Chartered Institute of Environmental Health. The report claims to take an "impartial, evidence based approach". It does anything but, so once again it falls to me to point out the more egregious errors.

The best place to start is on the very first page, which shows two schematic images of the fracking process. In both cases the scale of images is such that the depth of the well is smaller than the height of the drilling rig, implying that fracking is taking place at a depth of less than 100m, rather than the actual depth, typically 2 - 3km.

Similar images are provided on page 4, and nowhere are images with the correct scales shown. The images are so out of scale that the "impartial, evidence based" claim immediately cannot be taken seriously. The moment you see an image like this, you know what to expect.

To the non-expert, the degree of the error in these images might not be immediately apparent, so I did a little photoshopping to demonstrate. Imagine if you were reading a report on whether it was safe for commercial airliners to overfly cities at altitude, and on the first page of the report was the following image, I don't think it would be taken that seriously by air safety experts:


Thursday, 5 June 2014

A tale of two letters

Updated 17.6.2014

I've just spotted that Tim Smit, the founder of the Eden Project, Cornwall, is one of the signatories on the anti-fracking letter in the Times.

The Eden Project is currently planning an Engineered Geothermal System (EGS) to provide power and heat to the site. As any geologist will tell you, an EGS system requires "fracking" to create fractures in the granite rock to allow hot water to circulate. Or as the Eden Project describe it,
"Two boreholes, each around 25cm wide, are drilled into the rock to a depth of about 4.5km. This is done by pumping water down one borehole until the natural fractures in the rock are opened and water can flow."
In his own words, Sir Tim believes that "there is substantial evidence showing that fracking causes water stress and risks water contamination and soil contamination, earth tremors — and is a threat to human, wildlife, bird, fish and livestock health". I would love to know how he can think this and yet be happy for fracking to take place right next to the Eden Project.

Updated 6.6.2014 (see below)

Shale gas is back in the news this week with proposals to change laws for underground drilling access (more on this to come). In addition, two letters with numerous signatories have been published, one in the Times and one in the Guardian. I'll declare my conflict of interest in that you'll see my name towards the bottom of the Guardian letter.

For the sake of posterity, I thought it would be instructive to post the two letters next to each other, including the signatories, noting very different backgrounds between the signatories of the two letters.

Firstly, in the Times:

Sir,

The government’s plans to introduce fracking will change the UK for ever. David Cameron and the energy minister Michael Fallon have both told us to get ready for fracking. Already more than 60 per cent of the country will be licensed for fracking, and planning rules are being changed to allow for central government to override community objections.

The government says that fracking is safe even though it is banned in several European countries and US states. There is substantial evidence showing that fracking causes water stress and risks water contamination and soil contamination, earth tremors — and is a threat to human, wildlife, bird, fish and livestock health.

This technology will not bring down fuel bills and will not provide a jobs boom, but it has the potential to leave a damaging environmental legacy for future generations.
We urge the government to suspend fracking immediately while a genuinely independent, balanced and thorough public debate is held into the potential dangers this industry holds for the UK.

Professor Sir Harold Kroto FRS (Nobel Laureate in Chemistry), Dr Damien Short, Professor David Smythe, Professor Graham Warren, Professor Erik Bichard, Dr Hugh Montgomery (Professor of Intensive Care, UCL), Professor Lawrence Dunne, Dr David P Knight, Richard Murphy, John Christensen, Bruce Kent, Dr David Lowry, Dr Laura Adams, Chris Venables, Michael Mansfield QC, Bob Marshall-Andrews QC, Bianca Jagger, Peter Tatchell, Caroline Lucas MP, James Hansen, Mike Hill, Dr George Manos, Baron Rea of Eskdale, Vivienne Westwood OBE, Andreas Kronthaler, Katharine Hamnett CBE, Stella McCartney, Bella Freud, Alexandra Shulman, Lily Cole, Georgia May Jagger, Helena Bonham-Carter, Stephen Frears, Sue Jameson, James Bolam MBE, Ken Loach, Steven Berkoff, Jude Law, Miranda Richardson, Russell Brand, Sadie Frost, Frankie Boyle, Dr Pauline Kiernan, Liza Goddard, David Yates & Yvonne Walcott Yates, Jeremy Hardy, Greta Scacchi, Baroness Beeban Kidron, Lee Hall, Sam Branson, Tracey Seaward, Mark Tildsley, Michael Elwyn, Jenny Platt, Tim Preece, Alison Steadman, Geoffrey Munn OBE, Josh Appignanesi, Jonny Harris, Debi Mazar, Matt Lucas, Alan Carr, Noel Fielding, Lliana Bird, Dr Noki Platon, Juergen Teller, Willie Christie, Oliviero Toscani, Andy Willsher, Mary McCartney, Bryan Adams, Dr Andy Gotts MBE, Yoko Ono, Sir Paul McCartney, Sir John Eliot Gardiner CBE, Isabella de Sabata Gardiner, Danielle de Niese, Thom Yorke, Nick Grimshaw, St Etienne, Adrian Sherwood, Geoff Jukes, Jeff Barrett, Chrissie Hynde, Bobby Gillespie & Andrew Innes (Primal Scream), Asian Dub Foundation, Robert del Naja (3D, Massive Attack), Debbie Hyde (All Good Radio Show), Carl Barat, Paloma Faith, Sir Anthony Gormley OBE, Rachel Whiteread CBE, Cornelia Parker OBE, Tracey Emin CBE RA, Bob & Roberta Smith, Gavin Turk & Deborah Curtis, Sadie Coles, Anne Rothstein, Saskia Oldewolbers, Jamie Reid, Mona Hatoum, Michael Landy RA, Gillian Wearing RA OBE, Mark Wallinger, Heather Ackroyd & Dan Harvey, Jimmy Cauty, Joe Corre, Triodos Bank, Jeremy Leggett, Trillion Fund, Sir Tim Smit KBE (Eden Project), Ben Hopkins (founder benhopkins.co ltd), Lush Cosmetics, Dale Vince OBE (founder Ecotricity), Vince Adams (founder Respect Organics), Dietmar Hamann, Jeanette Winterson OBE, Neil Gaiman, Mark Haddon, Mark Ellingham, Mariella Frostrup, Rosie Boycott, Chris Stewart, George Monbiot, Naomi Klein, Avi Lewis, Dana Nuccitelli, Nicholas Shaxson, John Pilger, Will Self, Deborah Orr, Jonas Grimas, New Internationalist, Guillem Balague, Daryll Cunningham, Alan Moore, Philip Carr-Gomm, Alistair Beaton, Fergus Henderson, Mark Hix, Sam & Sam Clark, Geetie Singh, Guy Watson (founder, owner Riverford Organics), River Cottage, Hop Fuzz Brewery, Gabriele Corcos, Royal Society for the Protection of Birds (RSPB), Salmon and Trout Association, Greenpeace, Bill McKibben, 350.org, Friends of the Earth, Young Friends of the Earth, Environmental Justice Foundation (EJF), Gaia Foundation, Fuel Poverty Action, Tracy, Marchioness of Worcester (founder, Farms not Factories), End Ecocide EU, Manuel Cortes (General Secretary TSSA), Stephen Hedley (Assistant General Secretary RMT), Chris Baugh (Assistant General Secretary PCS).


Secondly, in the Guardian:

Since the Industrial Revolution almost 250 years ago, Britain's economic prosperity and national energy security have depended on having access to abundant supplies of domestic energy sources such as coal, oil and natural gas.

In 2004 the UK became a net importer of natural gas for the first time. Over the last three years, according to industry experts, output in the North Sea has fallen by 38%.

After nearly 30 years of near-abundant supplies of natural gas from the North Sea, we have become more exposed and vulnerable because of our increased reliance on foreign imports of energy to meet our power-generation needs. In 2014 UK government ministers said they expect Britain to be importing nearly three-quarters of our gas needs by 2030. But it does not have to be this way for ever.

According to the independent British Geological Survey, the Bowland Basin, which covers significant parts of north-west England, currently sits on top of 1,300 trillion cubic feet of natural gas. If we extract only 10% of this valuable resource, that is enough to boost our domestic supply to meet existing demand by at least a further 25 years, according to geoscientific experts.

Globally high prices for commodities and recent innovations mean this is now economically and technologically possible. As geoscientists and petroleum engineers from Britain's leading academic institutions, we call on all politicians and decision-makers at all levels to put aside their political differences and focus on the undeniable economic, environmental and national security benefits on offer to the UK from the responsible development of natural gas from Lancashire's shale.

Professor Richard Selley (Emeritus Professor of Petroleum Geology, Imperial College London), Dr Ruth Robinson (Senior Lecturer in Earth Sciences, University of St Andrews), Professor Ian Croudace (Director of Geosciences Advisory Unit, University of Southampton), Dr Lateef Akanji (Coordinator of Petroleum and Gas Engineering Programme, University of Salford), Dr Godpower Chimagwu Enyi (Lecturer in Petroleum and Gas Engineering, University of Salford, Manchester), Professor Ghasem Nasr (Director of Spray Research Group, Petroleum Technology Research Group and Leader of Petroleum and Gas Engineering, University of Salford, Manchester), Professor James Griffiths (Professor of Engineering Geology and Geomorphology, University of Plymouth), Associate Professor Graeme Taylor (Senior Lecturer in Geophysics, University of Plymouth), Professor Ernest Rutter (Professor of Structural Geology, University of Manchester), Professor Mike Bowman (Chair in Development and Production Geology, and President of the Petroleum Exploration Society of Great Britain, University of Manchester), Professor Stephen Flint (University of Manchester), Professor Jonathan Redfern (Chair of Petroleum Geoscience, University of Manchester), Dr Kate Brodie (Senior lecturer, University of Manchester), Dr Rufus Brunt (University of Manchester), Professor Kevin Taylor (University of Manchester), Dr Tim Needham (Needham Geoscience and visiting lecturer, University of Leeds), Professor Paul Glover (Chair of Petrophysics, University of Leeds), Professor Quentin Fisher (Research Director of School of Earth and Environment, University of Leeds), Dr Doug Angus (Associate Professor of Applied and Theoretical Seismology, University of Leeds), Dr Roger Clark (University of Leeds), Professor Wyn Williams (Director of Teaching: Rock and Mineral Magnetism, University of Edinburgh), Dr Mark Allen (University of Durham), Dr Howard Armstrong (Senior Lecturer in Department of Earth Sciences, University of Durham), Dr Martin Whiteley (Senior Lecturer in Petroleum Geoscience, University of Derby), Professor Jon Blundy (Professorial Research Fellow in Petrology, University of Bristol), Dr James Verdon (Research Fellow, University of Bristol), Professor Adrian Hartley (Chair in Geology and Petroleum Geology, University of Aberdeen), Dr David Iacopini (Lecturer, University of Aberdeen), Dr Nick Schofield (Lecturer, University of Aberdeen), Professor David Macdonald (Chair in Geology and Petroleum Geology, University of Aberdeen), Dr Andrew Kerr (University Cardiff), Professor Andrew Hurst (Professor of Production Geoscience, University Aberdeen), Dr Sina Rezaei Gomari (Senior Lecturer in Petroleum Technology and Engineering, Teesside University), Professor Agust Gudmundsson (Chair of Structural Geology, Royal Holloway), Dr David Waltham (Royal Holloway), Professor Joe Cartwright (Shell Professor of Earth Sciences, Oxford University), Professor Peter Styles (Professor in Applied and Environmental Geophysics, Keele University), Dr Steven Rogers (Teaching Fellow, Keele University), Dr Ian Stimpson (Senior Lecturer in Geophysics, Keele University), Dr Jamie Pringle (Senior Lecturer in Engineering and Environmental Geosciences, Keele University), Dr Gary Hampson (Director of Petroleum Geoscience MSc course, Imperial College London), Professor John Cosgrove (Professor of Structural Geology, Imperial College London), Professor Howard Johnson (Shell Chair in Petroleum Geology, Imperial College London), Professor Dorrik Stow (Head of Institute of Petroleum Engineering, Heriot-Watt University), Dr Gillian Pickup (Lecturer in Reservoir Simulation, Heriot-Watt University), Dr Zeyun Jiang (Lecturer, Heriot-Watt University), Dr Jingsheng Ma (Lecturer, Heriot-Watt University), Dr Gerald Lucas (Edge Hill University), Professor Charlie Bristow (Professor of Sedimentology, Birkbeck College, University of London), Dr Paul Grant (Lecturer, Kingston University).

Update 6.6.2014: A third letter
We've heard from anti-fracking groups, and from academic geologists who believe that shale gas can be extracted safely, and will generate significant economic benefits. Seems only fair that we also hear from the operators themselves - UKOOG wrote a response to the Times letter:

Sir,

I agree with Paul McCartney and the others who signed the letter on fracking (June 2nd) that we need to talk about fracking, and any debate should take account of all the facts as presented in the recent studies in the UK by eminent institutions and individuals including the Royal Society and the Royal Academy of Engineering, Public Health England, the Chartered Institute of Water and Environmental Management, and Professor David MacKay and Dr Tim Stone. All conclude that in a properly regulated industry the risks from fracking are small. We are happy to discuss the merits of shale with anyone who comes to it with an open mind. On this basis, Sir Paul, hopefully "We can work it out".

Ken Cronin (UKOOG).

Monday, 18 November 2013

Seismometer Deployments at Balcombe: Final Report

Cuadrilla's drilling at Balcombe attracted a lot of headlines. In a previous post I described (mainly by way of lots of holiday snaps) the deployment of seismometers by Bristol colleagues and I.

We have now completed our data analysis, and our results are available for you to read!

Hydraulic stimulation was not planned for this phase of Cuadrilla's operations. Therefore, we did not expect to see any induced seismic events. Nevertheless, we saw this as a good opportunity to attempt several objectives:

The first objective was simply about public perception. The average member of the public does not know much about earthquakes or about seismometers. They don't really understand magnitude scales, and they are not aware of the detection capabilities of modern seismometers. We hoped that the high levels of publicity surrounding Balcombe would give us a chance to help educate the public in these regards.

However, we had two main technical objectives as well. These relate to DECC's proposed traffic light scheme, whereby operators are required to stop if they trigger events above magnitude 0.0. Traffic light schemes are common for such operations - the Swiss in particular seem to like them. However, the minimum threshold here is far lower than anything used by the Swiss. Our aim is not to say whether this is appropriate or not, but its operation does pose some additional challenges, which our work seeks to address.

The first issue stems from the Gutenberg-Richter law, which states that the number of earthquakes (N) that occur which are larger than a given magnitude (M) is given by
                             log(N) = a - bM.
where a and b are measurable constants. The BGS gives values for a and b in the UK of 3.82 and 1.03, respectively. Using a magnitude of 0.0 (the lowest cutoff for the traffic lights), this relationship tells us that over 5,000 such events occur every year. The existing BGS seismic network is not capable of detecting these low magnitude events.

In order for the traffic light scheme to work effectively, we need to be able to distinguish between the 5,000 naturally occurring magnitude 0.0 and greater quakes that occur each year, and those induced by hydraulic stimulation. This requires us to have data about the naturally occurring events, which we do not currently have. Therefore, one purpose of our array was to begin to establish baseline measurements around a potential drilling site so that we can characterise any pre-existing, natural seismicity. This is but a small start, with only 1 month of background data. In an ideal scenario we'd want to have at least a year of baseline data.

The second purpose of our array was to measure typical levels of seismic noise and detectability thresholds for small, temporary arrays such as ours. The traffic light threshold of magnitude 0.0 is often at the threshold of detectability for surface seismometers. The detectability is controlled in part by the levels of noise on the seismometers. Although you might think the British countryside is a quiet place, there are many potential sources of noise, such as trains, roads, farm machinery, rivers. We wanted to see whether a small, relatively cheap array like ours would be helpful in administering the traffic light scheme, or whether more expensive microseismic monitoring methods are likely to be needed.

So, what did we find?
Well, the most obvious thing we saw was the train, made famous by local concerns about seismic impacts on the viaduct. We saw the train on all 4 seismic stations that we deployed. Here is an example:
You can see that the train is coming from the north. It is seen on station BA02 first, which is the northernmost, and on BA04 last, which is the southernmost. BA04 is only 150m from the rail line, so you can see the biggest signal on this station.

We wanted to compare the vibration from the train with typical earthquake magnitudes. To do this we used the UK magnitude scale, which is defined as
                             Ml = log(A) + 0.95log(R) + 0.00183R - 1.76,
where A is the amplitude of the signal at the station, and R is the distance between earthquake and seismometer. We modelled earthquakes occurring directly below the drilling site, and found that a quake with magnitude of 1.5 (the same as the 2nd Preese Hall quake) produced a similar amount of vibration to the train going past at 150m.

We used an automated trigger algorithm to search our data for potential local seismic events. Sadly, we didn't see anything that looked like a local earthquake, either before or during drilling.

The seismometers that we used are actually designed to detect earthquakes from around the globe. We did spot a number of such events (called "teleseismic arrivals"). Here's an example from a magnitude 7.7 event in Pakistan:
This map shows all 25 such events that we spotted:

One of our stations was only 300m from the drilling site. We did notice that things got slightly noisier on this station when drilling started. This figure compares the background noise before and during drilling. A simulated M0.5 event is shown - this shows up above the noise for both cases.
We didn't see any events during our monitoring period. However, we wanted to work out what we could have seen, had something happened. We simulated earthquakes occurring below the drill site, with a variety of magnitudes, and ran the simulated data through our automated detection algorithm, to see what was the smallest that could be reliably identified, given our recorded noise levels

We found that magnitude -0.2 was the smallest we could see. This simulated event is shown below:
As you can see, it just peaks up above the noise. This is the smallest event we can expect to see. This is just below what is required for the traffic light scheme, so a small array like this could work. However, I'd want to see a larger number of stations to really push the detection limits below the magnitude 0.0 cutoff.

Discussion - Accurate event magnitudes?
We finish with a number of recommendations for the implementation of the traffic light scheme (TLS). A fact unbeknownst to most non-seismologists is that there are in fact a number of different magnitude scales, depending on how magnitude is measured. They are all designed to be close to each other, however they are not always exactly the same.

The most common magnitude scale is known as "local magnitude", or ML. This is basically the good ol'fashioned Richter scale, and is fairly simple to compute. You simply measure the maximum amplitude of the seismic trace, you take the distance from source to receiver, and you put it into a local magnitude equation as I outlined above.

An alternative magnitude scale is the "Moment magnitude", or Mw. This directly relates to the moment (read 'force' or 'energy' in layman's terms) released by the earthquake, and in turn to both the size of the fault and the amount that the fault slipped. Mw is slightly harder to compute - you have to look at the frequency content of the earthquake signals - but probably a better representation of the physical process occurring in an earthquake (as opposed to an empirical approximation, as provided by ML).

Small, local arrays such as ours will typically report ML. However, the dense coverage provided by microseismic arrays (as now installed at Preese Hall) often report Mw. It needs to be made absolutely clear how these different types of measurements will be factored into the TLS, because they may not be exactly the same - indeed at small magnitudes they can be different by half a magnitude unit or more. So, for example, what happens if a quake is measured with ML = -0.1 but Mw = +0.1?

Similarly, all measurements of magnitude are subject to an error. This is rarely reported for the large earthquakes you see on TV - the relative signal to noise ratios for a large event are so large that you can be sure that it is magnitude 6.5 (or whatever) ± a very small amount. However, as you enter the world of micro-seismic events, the signal to noise ratio deteriorates (as you can see in image #6 above). As this happens, the error in the calculation gets larger. Again, the incorporation of errors into the TLS needs to be clarified - what happens if an event has magnitude -0.1 ± 0.2?

These issues do not invalidate the traffic light scheme. However, given that operational decisions, and therefore potentially millions of pounds, hang on the accurate characterisation of event magnitudes, it would be helpful to iron out any potential inconsistencies now, rather than in the wake of another induced event.


In closing, I would like to thank the co-authors of this work, who don't yet have blogs of their own.

Wednesday, 31 July 2013

Seismometer deployment to monitor drilling at Balcombe


If you follow me on twitter as well as reading my blog will know that I go by the name @TheFracDoctor. This choice of name was influenced in part by the fact that I had recently finished my PhD, and as anyone who has experienced the flush of post-viva success, there is the temptation to put the word ‘Doctor’ in front of everything. 

But also it is the role of the doctor to monitor the health of his patient, and that is how I see seismic and micro-seismic monitoring – a tool to monitor the health of a fracture stimulation.

In the last few weeks I’ve had the opportunity to do this for real in the UK for the first time: deploying seismometers around Cuadrilla’s planned Balcombe well. I’ll note right now that the current Cuadrilla plan is to drill into limestone for conventional oil, with no intention of hydraulic fracturing at this stage, but we wanted to get some experience deploying seismometers for this sort of situation.

However, Balcombe is the site of the now-infamous ‘Battle of Balcombe’ and has been at the center of much debate of unconventional gas extraction (these stations were put in a month ago, well before the events of last week). Of particular focus has been the risk of seismic activity to the Balcombe Viaduct.

This spectacular bridge, built in 1841, still carries the main London-to-Brighton rail line:


After the seismic events during stimulation at the Preese Hall well, Blackpool, concerns were raised about the possibility of similar seismic activity affecting this bridge. So we decided to deploy seismometers while they drill their Balcombe well. There are no plans for fracking at the moment, so we’re not expecting any seismic activity. Our main aims were (1) to get some experience deploying seismic stations in rural England, and (2) to record baseline activity prior to drilling.

Baseline data will help us understand the noise levels in the area, which will determine the size of the smallest earthquake we can detect – obviously the lower the noise level, the smaller event you can detect. The current traffic light scheme for seismicity proposed by DECC requires events as small as M0.0 to be detected. We want to see if this will be possible with a small array of 4 surface seismometers (we will compute the expected shaking from an M0.0 event, and see if it emerges above the noise).

Baseline data will also enable to see what changes (if any) drilling activities produce.

I will post updates as and when we collect and analyse the data. For now, this seems like a good time to share some holiday snaps, so you get to learn about what we do when we deploy seismometer arrays, and what they look like.

Firstly, here’s the piece of kit that we use: a Trillium 120 seismometer:


This is a fairly standard piece of kit in earthquake seismology, capable of measuring the vibration of the earth across a wide frequency, from long periods (up to 60 seconds) up to the sampling rate of 250Hz.

To reduce the noise from things like wind and rain, they need to be buried 50cm or so under ground. Which means you have to dig a hole. I used to work on building sites during my A-levels, and I was delighted when I got my degree, knowing that my days of manual labour were over (because digging holes all day is TOUGH work). Yet, a masters degree and PhD later, and here I am digging holes all day!


Once the pit is ready, the seismometer is carefully placed into the hole:


The batteries and data logger go in the steel box next to the pit. We run cables, insulated inside fire hose, from the instrument into the box:


Initial covering for the instrument, to further minimise surface noise, is provided by its ‘lid’, the black dome you can see below:


Once we are happy that the instrument is working properly, we fill the hole (being careful not to dislodge the insulating cover from the instrument. We lay a waterproof sheet just below the surface, and pile turf on top as a final covering:


Finally, we put a small chicken-wire fence around the station. This is more of a deterrent than anything else: it’s not likely to stop a marauding cow, nor is it really capable of keeping out a determined rodent (animals chewing on loose cables is a real problem in many seismic deployments):


And after all that (a couple of hours work at least), you have your seismic station:


We placed 4 stations in total, including one a few hundred yards from the viaduct:


As we set this station up, we could see the vibrations from the trains going past every 5 minutes recorded on our seismometer. It will be interesting to see what caused more vibration – the Preese Hall earthquakes or the train going past at a distance of a couple of hundred yards. After all, the initial concern at Balcombe was that seismicity would trouble the bridge – even though this is a bridge that is being shaken by an express train every 5 minutes.

We enjoyed our two days in the picturesque British countryside, and we were very glad we missed all the protestors. Fortunately, the stations are all a couple of km at least from the London Road protest site, and accessible from other roads, so that’s a gauntlet we won’t have to run. The only disturbance we saw was from these guys:


So there’s our seismic deployment in Balcombe. More to follow once we’ve analysed the data.